In today’s data-driven world, the ability to effectively visualize and analyze information has become a critical skill for businesses of all sizes. Whether you’re a startup founder, a marketing professional, or a data analyst, having access to powerful charting and visualization tools can make a significant difference in your ability to uncover insights, communicate findings, and drive informed decision-making.
ChartBrick, a revolutionary lifetime deal that is transforming the way businesses approach data visualization. ChartBrick is a comprehensive charting platform that empowers users to create stunning, interactive charts and dashboards with ease, all while enjoying the benefits of a one-time payment and unlimited usage.
What is ChartBrick?
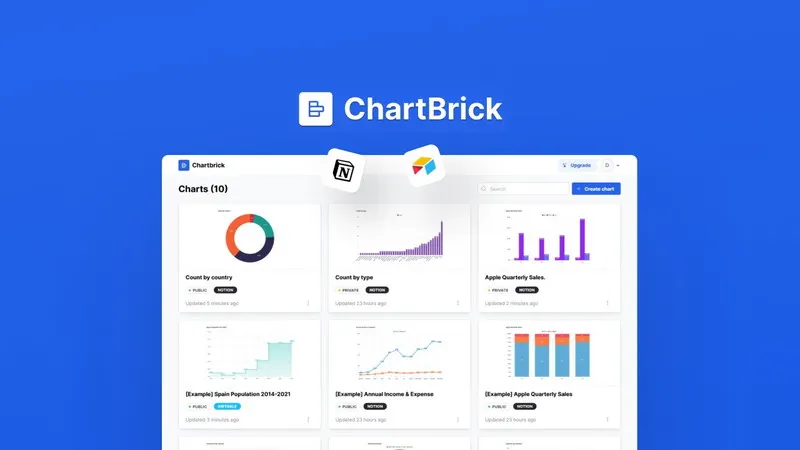
ChartBrick is a cloud-based data visualization platform that offers a wide range of chart types, customization options, and advanced features to help you bring your data to life. From simple line charts and bar graphs to complex scatter plots and treemaps, ChartBrick has the tools you need to create visually compelling and insightful visualizations.
One of the key advantages of ChartBrick is its lifetime deal offering. Unlike traditional SaaS models that require ongoing subscription fees, ChartBrick allows you to purchase a one-time license that grants you perpetual access to the platform and all its features. This means you can enjoy the benefits of a powerful charting tool without the burden of recurring costs, making it a cost-effective solution for businesses of all sizes.
Key Features of ChartBrick
- Extensive Chart Types: ChartBrick offers a comprehensive library of chart types, including line charts, bar graphs, scatter plots, pie charts, treemaps, and more. You can easily select the right visualization for your data and customize it to your liking.
- Advanced Customization: With ChartBrick, you can fine-tune your charts and dashboards to match your brand’s visual identity. Adjust colors, fonts, labels, and other design elements to create a cohesive and professional look.
- Interactive Dashboards: Bring your data to life with interactive dashboards that allow users to explore and manipulate the information in real-time. ChartBrick’s dashboard builder makes it easy to create comprehensive data visualizations that tell a compelling story.
- Data Connectivity: ChartBrick seamlessly integrates with a variety of data sources, including CSV files, Google Sheets, and SQL databases, making it easy to import and visualize your data.
- Collaboration and Sharing: Share your charts and dashboards with colleagues, clients, or stakeholders with just a few clicks. ChartBrick offers secure sharing options, including the ability to generate embeddable code for easy integration into your website or presentations.
- Responsive Design: ChartBrick’s charts and dashboards are designed to be mobile-friendly, ensuring your visualizations look great and perform well on any device.
- Lifetime Access: With the ChartBrick Lifetime Deal, you can enjoy unlimited access to the platform and all its features for a one-time payment, eliminating the need for ongoing subscription fees.
Who Can Benefit from ChartBrick?
ChartBrick is a versatile tool that can benefit a wide range of professionals and organizations, including:
- Startups and Small Businesses: Leverage ChartBrick’s powerful charting capabilities to make data-driven decisions, track key metrics, and communicate your progress to investors and stakeholders.
- Marketing and Sales Teams: Use ChartBrick to create visually compelling reports, dashboards, and presentations that help you showcase your performance, identify trends, and make more informed marketing and sales decisions.
- Data Analysts and Business Intelligence Professionals: Streamline your data visualization workflows and create custom dashboards that provide deep insights into your organization’s performance.
- Freelancers and Consultants: Impress your clients with professional-grade data visualizations that help you communicate your findings and recommendations more effectively.
- Educators and Trainers: Enhance your teaching and training materials with interactive charts and dashboards that engage your students and help them better understand complex data.
Why Choose the ChartBrick Lifetime Deal?
The ChartBrick Lifetime Deal offers several compelling benefits that make it a smart investment for businesses and professionals:
- Cost-Effective: By paying a one-time fee, you can enjoy unlimited access to ChartBrick’s features and functionality, eliminating the need for ongoing subscription costs.
- Scalable: As your business grows, you can continue to leverage ChartBrick’s powerful charting capabilities without worrying about additional user licenses or fees.
- Flexible: ChartBrick’s wide range of chart types, customization options, and data connectivity features make it a versatile tool that can adapt to your evolving data visualization needs.
- Hassle-Free: With the Lifetime Deal, you can focus on creating amazing visualizations without the hassle of managing software licenses or renewals.
- Future-Proof: As ChartBrick continues to evolve and introduce new features, you’ll have access to them at no additional cost, ensuring your investment remains valuable for years to come.
Frequently Asked Questions (FAQs)
Can I use ChartBrick with WordPress?
Yes! ChartBrick provides an iframe feature that allows users to embed their charts directly into WordPress pages or posts. This feature makes it easy for WordPress users to leverage stunning visualizations without extensive coding knowledge.
Is there a limit on how many charts I can create?
With the lifetime deal, there are no limits on the number of charts or dashboards you can create in ChartBrick. You have the freedom to generate as many visualizations as needed for your projects without incurring additional fees.
What types of charts can I create with ChartBrick?
ChartBrick offers an extensive library of chart types, including line charts, bar graphs, pie charts, scatter plots, treemaps, area charts, heat maps, and more. This variety allows users to choose the most suitable visualization for their data analysis needs.
Are there any tutorials available for using ChartBrick?
Yes! ChartBrick provides comprehensive documentation and tutorials on its platform to help users get started quickly. Whether you’re a beginner or an experienced user seeking advanced tips, you’ll find valuable resources readily available.
Can I customize my charts according to my brand’s style?
Absolutely! ChartBrick allows users to customize colors, fonts, labels, and other design elements for their charts and dashboards. This ensures that your visualizations align perfectly with your brand identity.
ChartBrick Review | Conclusion
In today’s data-driven landscape, the ability to effectively visualize and analyze information has become a crucial competitive advantage. With the ChartBrick Lifetime Deal, you can unlock the power of data visualization and transform the way you make informed decisions, communicate insights, and drive business growth.
Whether you’re a startup founder, a marketing professional, or a data analyst, ChartBrick offers a comprehensive, cost-effective, and future-proof solution that can help you unlock the full potential of your data. Explore the platform today and discover how ChartBrick can revolutionize the way you approach data visualization.


